

Integrating Slicers with Dynamic Image
Slicers can be used in dynamic graphics as both a source of property values to show in the graphic as well as a way to change the queries driving the graphics in the data driven properties of the graphic itself.
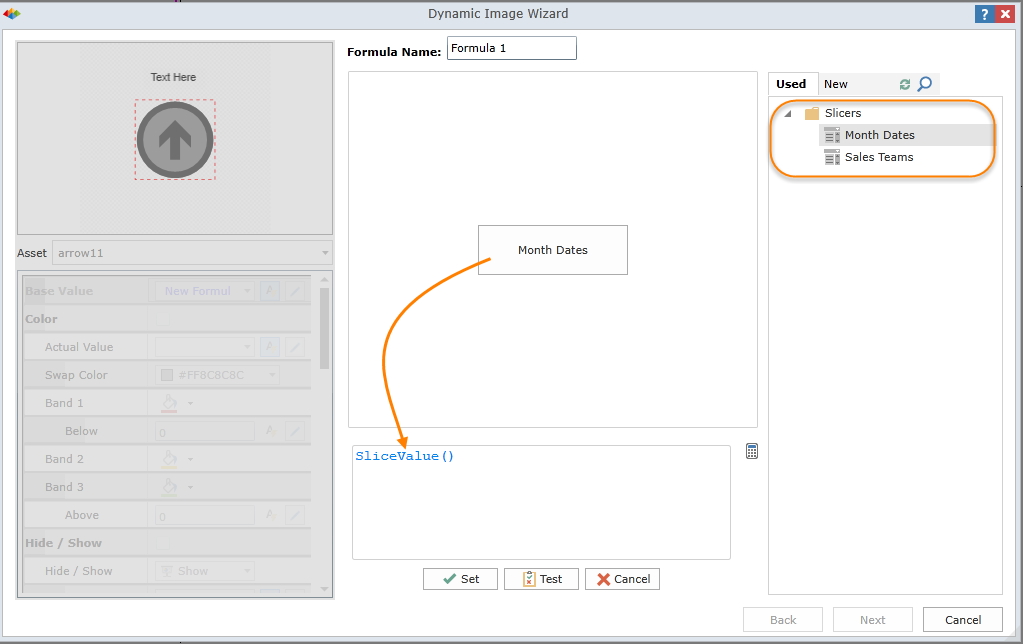
Showing Slicer values in the Graphic
Once slicers have been placed on the host slide canvas, they will show up as content items that can be included in the dynamic formula editor under the "used" tab (orange highlight below).
Clicking on the slice will allow users to extract the slicers current "value", which can then be used in the formula (orange arrow). Often this is useful for conditional logic or when the slice selection should appear as a text string in a text element.
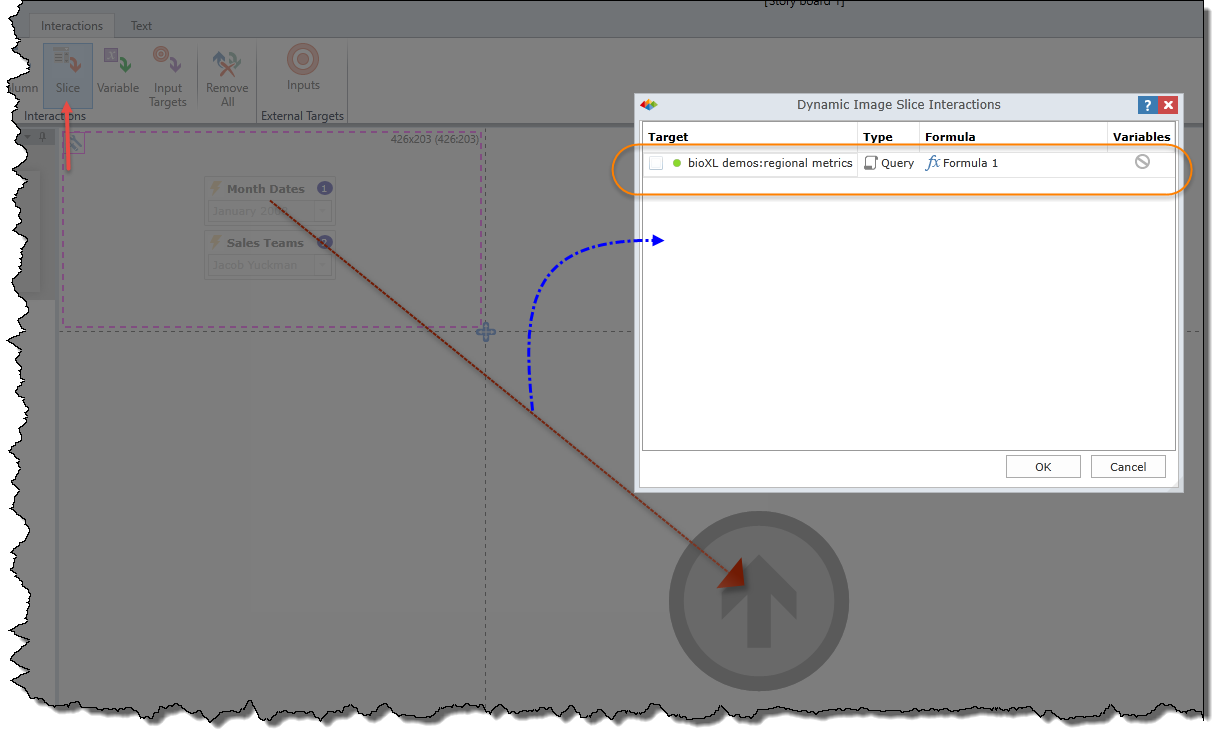
Slicing Queries in Dynamic Graphics
The alternative usage for slicers in dynamic graphics is by using them to slice the underlying queries in the graphic itself. This is the classic usage of slicers and is analogous to the standard data interaction capability used with other reporting components.
After drawing an interaction to the target graphic, users will be presented with a dialog. In the dialog, the user need to select (by clicking the checkbox) which queries (orange highlight below) will be "sliced" by the source slicer in runtime.
Home |
Table of Contents |
Index |
User Community
Pyramid Analytics © 2011-2022